
ES TECK MEXICOHealth Technology. A more comprehensive functional view.
For healthcare professionals

Beyond laboratory tests and CT scans,

what functional information can healthcare professionals access today to better support their patients?

Non-invasive physiological measurements measured in the clinic, organized to support professional assessment, explain findings, and track changes over time.
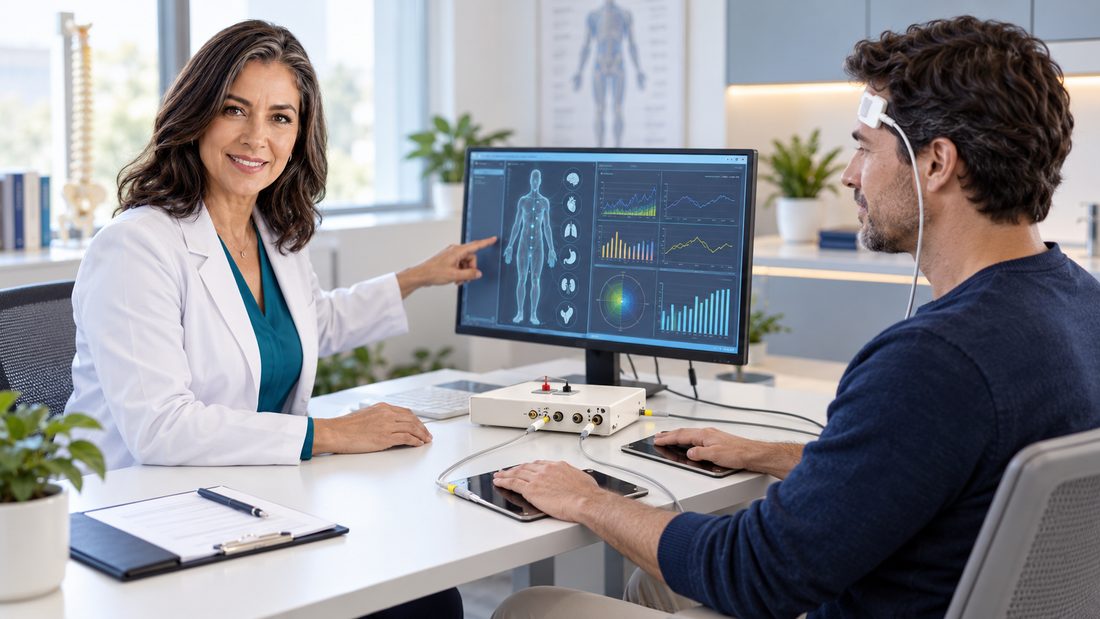
Elena, a healthcare professional, presents visual information during a patient consultation.
Make every consultation an experience your patient can see, understand, and value.Illustrative consultation image.
Connected information

Understand how your patient’s information is brought together.

During each assessment, ES TECK uses its measurement modules simultaneously. The technology cross-references bioimpedance, heart rate variability, oximetry, pulse wave, and body composition parameters to generate an integrated visual report.

Cross-analysis brings the results together so the professional can review them within a shared functional context.

Integrated results: an educational adaptation of the first diagram in the manual.
EIS and interstitial fluid. Results from the electroimpedance signal module, which measures electrical conductivity associated with interstitial fluid.

Source report examples

Original report screenshots contain Spanish labels. The diagram and explanations on this page are provided in English.

More value for your practice

Information you can review, explain, and compare.

The value for your practice lies in how you use this information during the consultation and in subsequent assessments.

Broaden the available information

Review functional parameters from the time of assessment alongside your patient’s clinical history and test results.

Make findings easier to explain

Use visual reports to explain what was observed, how it fits into your assessment, and which aspects may need further attention.

Track changes against a baseline

Compare assessments performed under consistent conditions, observe trends, and support follow-up of the treatment prescribed by the professional.

Explore further when you need to

Explore how the information from the different parameters measured during the assessment relates to one another.

This second diagram organizes physiological references from the five technologies. Zoom in on each area and review the explanation of its terms.

PhotoplethysmographyBody composition Vascular resistancesystemic · SVR Blood pressureQ · SVR Renin–angiotensin system−d/a LV functionb/a and EF Atherogenic index / lipidemiaCarotid resistance Cardiac output (Q) Cerebral blood flowACTH · cortisol · TSH · ADH Respiratory systemSpO₂ %Oximetry Immunesystem EIS · Diagram referencesMicrocirculation · Tissue blood flowSDC / EPA–SPA · Tissue densityESG HF/VLF · ATP productionSDC / electrolytes HRV · Heart rate variabilityHR · LF/HF Fluid balanceElectrolyte balanceK⁺ Renal systemLiver · Pancreas The diagram linksbody fat, cardiacoutput, and pro-inflammatory cytokines.

Reading the diagram

    Educational adaptation of the second manual diagram. The connections summarize the physiological relationships shown.

    References to hormones, electrolytes, and organs describe relationships shown in the diagram. They do not represent direct measurements of all these substances or provide diagnoses.

    Technical notes and abbreviations

    Oximetry and pulse wave

    SpO₂: peripheral oxygen saturation. Photoplethysmography: an optical recording of the pulse wave. The diagram includes circulatory, respiratory, and blood-flow references.

    Heart rate variability

    HRV: heart rate variability. HR: heart rate. LF/HF: low- and high-frequency components.

    Bioimpedance and body composition

    EIS: electroimpedance signals. ABI: bioimpedance analysis. The diagram includes references to microcirculation, body fluids, electrolytes, and body fat.

    Other abbreviations in the diagram

    LV: left ventricle. EF: ejection fraction. SVR: systemic vascular resistance. Q: cardiac output. ATP: adenosine triphosphate. SDC, EPA–SPA, and ESG HF/VLF are retained as shown in the source.

    Professional judgment gives meaning to the data

    Functional information for assessment in context.

    This review may provide functional indicators related to different body systems, such as the circulatory and nervous systems, and help the professional identify situations that may warrant further assessment. The professional interprets the findings alongside the clinical history, symptoms, and available tests, and determines their relevance.

    ES TECK provides complementary functional information; it does not diagnose or prescribe treatment.
    Learn more before you decide

    See how it could fit into your practice.

    Review the assessment process, reports, and follow-up options in a personalized demonstration.

    Request a demonstration